Dots on the Bus - Urban Data Challenge 2013
Beschreibung
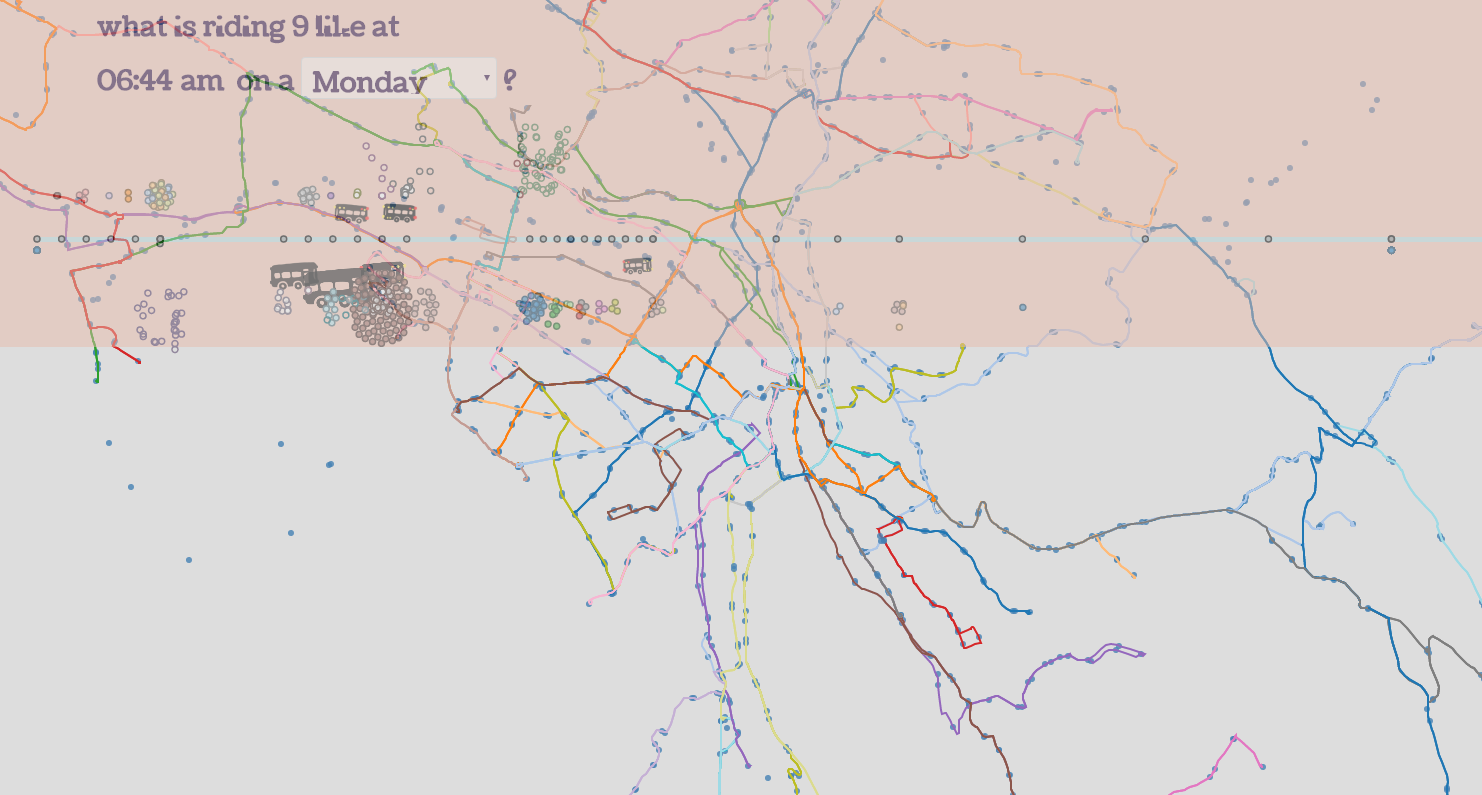
Sometimes riding transit can seem intimidating, but this visualization proves it: everybody’s doing it. Pick a route off the map and watch a day in the life of the line. Buses speed by, passengers jumping on and off. Some lines are slow, some are hopping, and rush hour is often hilarious. This Datavisualisation is available for Zurich, Geneva and San Francisco.
Webseite
http://urban-data.herokuapp.com/zurich.htmlTags
Datensätze
Bitte versuch es mit einer anderen Suche.