Suchergebnis: 4 Treffer
Frustration Index - Urban Data Challenge 2013
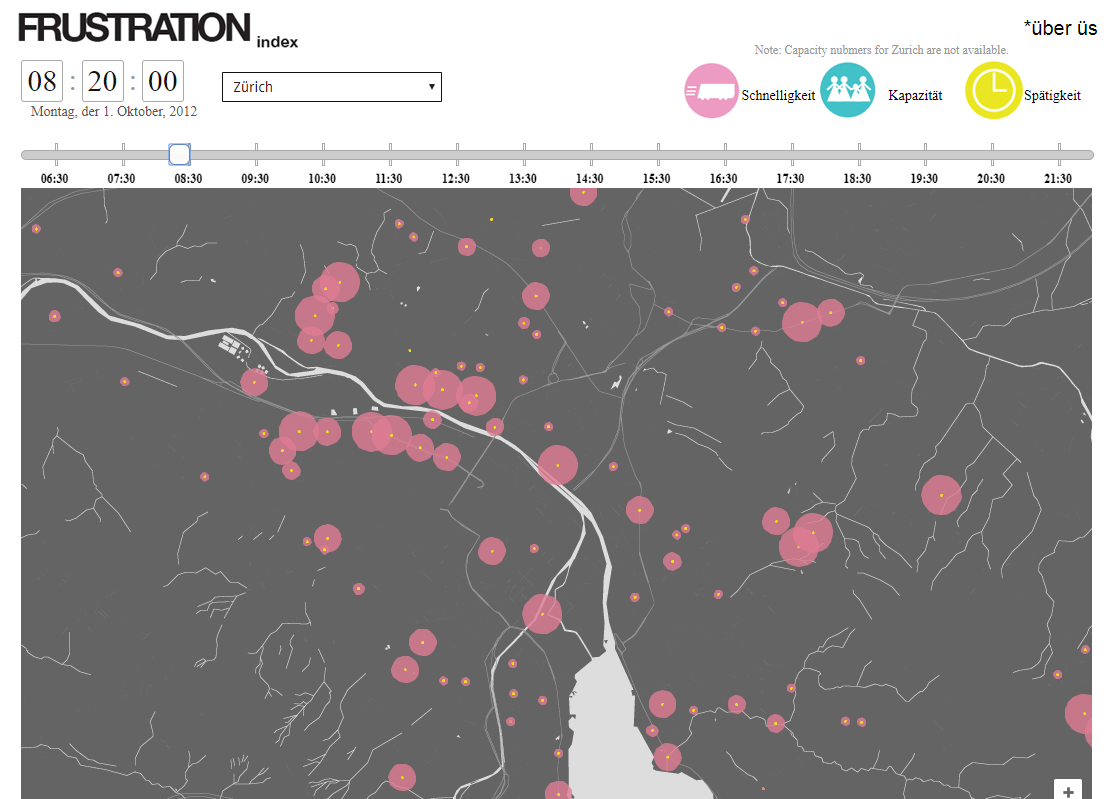
Frustration Index shows the Level of Service (or Frustration) for transit services in San Francisco, Geneva, and Zurich. Our web application visualizes frustration factors...
Github Interactive Things - Grundlagedaten für Urban Data Challenge von 2013
2013: This repository provides you with public transportation data sets from Zurich, San Francisco and Geneva for the www.urbandatachallenge.org. Throughout the repository...
Dots on the Bus - Urban Data Challenge 2013
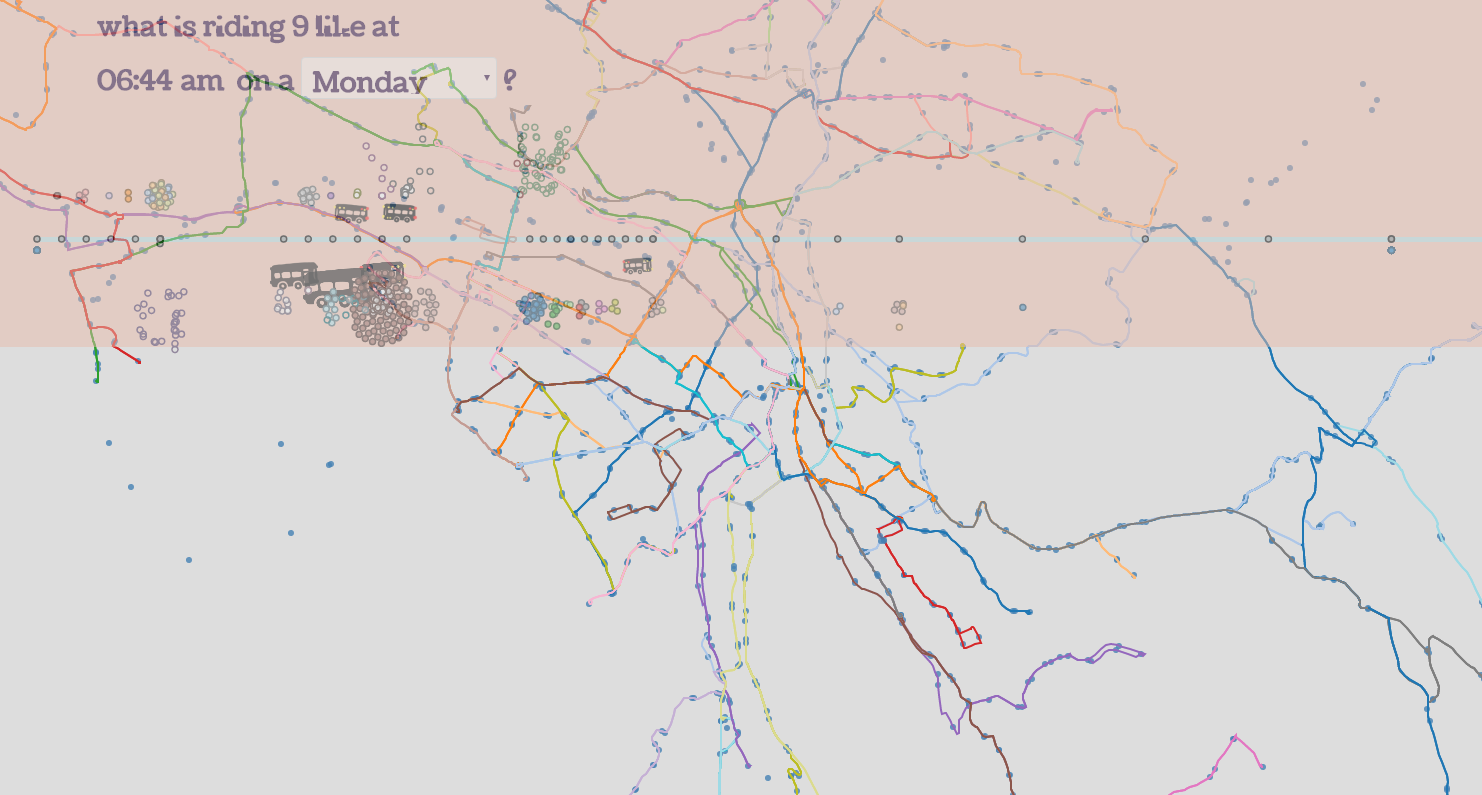
Sometimes riding transit can seem intimidating, but this visualization proves it: everybody’s doing it. Pick a route off the map and watch a day in the life of the line. Buses...
Transit Quality + Equity - Urban Data Challenge 2013
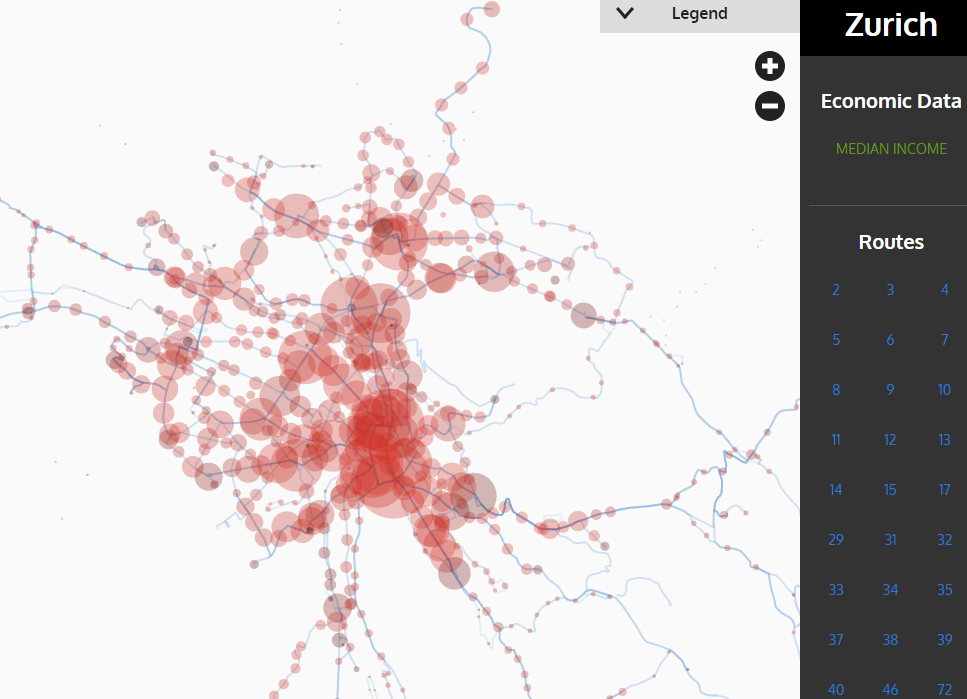
Transit performance is often solely measured by speed and efficiency. But how well do transit systems actually serve the diverse populations in a city? Do people of different...